MPPT Efficiency Explained: Why 99.5% Matters More Than You Think
What MPPT Actually Does (In Plain Language)
Your solar panels produce electricity, but they don't produce it at a constant rate. The amount of power changes with sunlight intensity, temperature, cloud cover, and even dust on the glass. Maximum Power Point Tracking (MPPT) is the algorithm inside your inverter that continuously adjusts the electrical operating point to extract the most power available at any given moment.
Think of it this way: a solar panel is like a water faucet. MPPT is the hand that keeps turning the valve to find the perfect flow rate. Without it, your inverter would operate at a fixed point — and you'd lose significant energy every time conditions shift.
For a typical 10 kW residential system, good MPPT tracking can capture 30–50 kWh more per year compared to a fixed operating point. That's enough to power a refrigerator for a month.
How MPPT Efficiency Is Measured — And Why Most Numbers Are Misleading
MPPT efficiency is expressed as a percentage: the ratio of power actually extracted to the theoretical maximum available. Sounds straightforward, but here's the catch — there are two different ways to measure it.
Static MPPT efficiency tests under constant, unchanging conditions. Under these lab-perfect scenarios, nearly every inverter achieves 99.9% or higher. This number looks impressive on a datasheet but tells you almost nothing about real-world performance.
Dynamic MPPT efficiency tests under rapidly changing irradiance — the kind of conditions you actually experience outdoors. Clouds pass, shade shifts, temperatures fluctuate. This is where cheaper algorithms struggle and expensive ones shine.
| MPPT Algorithm | Static Efficiency | Dynamic Efficiency | Real-World Behavior |
|---|---|---|---|
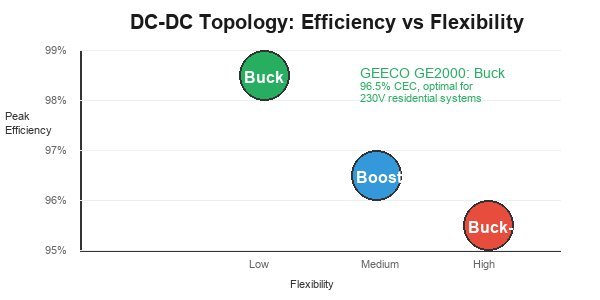
| Perturb & Observe (P&O) | 99.9% | 95–97% | Oscillates around peak; slow to adapt |
| Incremental Conductance | 99.9% | 97–98% | More accurate; heavier computation |
| AI-Adaptive (GEECO) | 99.9% | 99.0–99.5% | Predicts changes; fastest response |
The lesson: when a manufacturer quotes "99.9% MPPT efficiency," check whether it's static or dynamic. If they don't specify, it's almost certainly static — the easier number.
The 97% vs 99.5% Gap: Why It Compounds Over 25 Years
A 2.5% difference sounds small. Over one day, it's barely noticeable. But solar systems operate for 25+ years, and that gap compounds dramatically.
Consider a 10 kW system producing 14,000 kWh annually in a temperate climate:
- At 97% dynamic MPPT efficiency: 13,580 kWh/year captured
- At 99.5% dynamic MPPT efficiency: 13,930 kWh/year captured
- Annual difference: 350 kWh — roughly $70 at $0.20/kWh
- Over 25 years: 8,750 kWh — roughly $1,750 in lost revenue
For a 100 kW commercial system, that 2.5% gap translates to over $17,500 in lifetime losses. The math is simple: MPPT efficiency is not a rounding error — it's a revenue multiplier.
And the gap widens further in challenging climates. In regions with frequent cloud cover (UK, Netherlands, northern Germany), irradiance changes rapidly. A 97% P&O algorithm may drop to 93% under these conditions, while an AI-adaptive tracker maintains 98%+. In tropical climates with extreme heat, Vmpp shifts significantly and requires fast, accurate tracking to prevent power loss.
DC-DC Conversion Topology: Buck, Boost, or Buck-Boost?
The MPPT circuit's topology — how it converts DC voltage — directly affects efficiency, cost, and reliability. Here's how the three main approaches compare:
| Topology | How It Works | Peak Efficiency | Best Use Case |
|---|---|---|---|
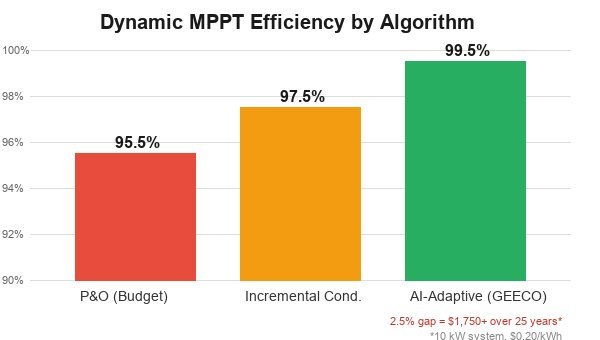
| Buck (Step-Down) | Reduces panel voltage to match grid | 98–99% | Panel Vmp > grid voltage (230V systems) |
| Boost (Step-Up) | Increases panel voltage to match grid | 96–97% | Low-voltage panels or micro-storage |
| Buck-Boost | Handles both directions | 95–96% | Maximum flexibility; higher component count |
GEECO's GE2000 micro inverter uses a buck topology optimized for 230V markets. This choice eliminates the extra switching stage required by buck-boost designs, reducing component count and pushing peak conversion efficiency to 96.5% CEC — among the highest for micro inverters in its class.
The engineering trade-off is clear: buck topology sacrifices flexibility (it can't handle panels with Vmp below grid voltage) but gains efficiency and reliability. For the vast majority of residential installations where panel Vmp exceeds the grid, this is the optimal choice.
Real Data: GEECO GE2000 Lab Test Results
Independent lab testing (IEC 61683:2013 methodology) of the GEECO GE2000 micro inverter reveals:
- Static MPPT efficiency: 99.99%
- Dynamic MPPT efficiency: 99.5% (measured under EN 50530 rapid irradiance cycling)
- CEC weighted efficiency: 96.5%
- Start-up voltage: 22V — one of the lowest in the micro inverter class, enabling 30+ minutes of extra generation at dawn and dusk
- MPPT voltage range: 22–60V — wide enough to maintain tracking across all temperature conditions
The 99.5% dynamic MPPT figure is particularly significant. EN 50530 testing simulates the rapid irradiance changes that occur on cloudy days — the exact conditions where cheaper P&O algorithms lose the most power. GEECO's AI-adaptive algorithm, developed in-house with expertise from IoT and control science, anticipates irradiance shifts rather than merely reacting to them.
For context, the MPPT off-grid inverter market reached $5.35 billion in 2024 and is projected to grow at 6% CAGR through 2035 (WiseGuy Reports, 2025). Within this market, micro inverters with high dynamic MPPT efficiency are gaining share as consumers recognize that the 2–3% gap between budget and premium algorithms translates to measurable lifetime revenue differences.
How Temperature, Shading, and Age Affect MPPT Performance
MPPT efficiency isn't a fixed number — it shifts with environmental conditions. Understanding these factors helps you evaluate whether a quoted efficiency figure is realistic for your installation.
Temperature: As panel temperature rises, Vmpp drops significantly. A panel at 70°C (common on rooftops in summer) has a Vmpp roughly 15% lower than at 25°C STC. The MPPT algorithm must detect this shift and adjust within milliseconds. Slow algorithms overshoot or undershoot, wasting energy during the hottest — and often highest-irradiance — hours.
Shading: Even partial shading on one cell creates a localized voltage drop that reshapes the entire I-V curve, potentially creating multiple local maxima. Advanced MPPT algorithms must distinguish the global maximum from local peaks. P&O algorithms frequently get "stuck" on a local peak and never find the true maximum.
Age: Panels degrade 0.5–0.8% per year. After 10 years, Vmpp shifts measurably. A good MPPT algorithm adapts continuously; a mediocre one was calibrated for day-one conditions and gradually falls behind.
What to Look for in a Spec Sheet (Buyer's Checklist)
Most spec sheets bury the important MPPT details behind impressive-looking static efficiency numbers. Here's what actually matters:
- Dynamic MPPT efficiency (EN 50530): The only number worth comparing. Look for 99%+. If the spec sheet doesn't mention EN 50530, the manufacturer is hiding something.
- MPPT voltage range width: Wider ranges (e.g., 22–60V for GEECO GE2000) maintain tracking across temperature extremes. Narrow ranges mean power loss in hot summers or cold mornings.
- Start-up voltage: Lower is better. 22V start-up (GEECO) means generation begins at dawn; 40V+ start-up means wasted early-morning energy.
- Tracking speed: How fast the algorithm responds to irradiance changes. AI-adaptive algorithms respond in under 0.01s; P&O may take 0.5–2s.
- Algorithm type: P&O is 1970s technology. Incremental conductance is better. AI-adaptive is current best practice. Ask your supplier which they use.
One honest limitation: no MPPT algorithm is perfect under every condition. Even 99.5% dynamic efficiency means 0.5% of available power is lost during tracking transitions. The question isn't whether loss exists — it's whether the loss is 0.5% or 3%.
The Engineering Trade-Offs: Cost vs Efficiency
Why don't all inverters use AI-adaptive MPPT? The answer is cost — both in components and development.
AI-adaptive MPPT requires more processing power (dedicated DSP or AI chip), higher-quality current/voltage sensors (LEM or VAC-brand components), and significantly more R&D investment. GEECO's in-house algorithm was developed by a team with PhD-level expertise in control science and IoT — a resource most budget manufacturers simply don't have.
The cost difference between a 97% and 99.5% dynamic MPPT inverter is typically $15–30 per unit at component level. Over a 25-year system life, that $30 investment returns $1,750+ in additional generation. The ROI is clear — but only if you look at lifetime economics rather than upfront price.
As SiC (silicon carbide) and GaN (gallium nitride) wide-bandgap semiconductors gain adoption — penetration exceeded 25% in premium inverters by 2025 (GEPresearch, 2026) — the cost gap will narrow. These materials enable higher switching frequencies with lower losses, making 99.5%+ efficiency achievable at lower cost. GEECO's roadmap includes SiC-based designs for next-generation products.
Bottom line: MPPT efficiency is the single most underappreciated number on your inverter spec sheet. A 2.5% gap that sounds trivial compounds into thousands of dollars over a system's lifetime. When you compare inverters, demand the dynamic MPPT efficiency number — tested under EN 50530 — and make your decision on real-world data, not marketing-friendly static figures.